
2020
https://www.nature.com/articles/s41586-020-2969-2
- Article
- Open access
- Published:
A metastasis map of human cancer cell lines
Nature volume 588, pages 331–336 (2020) Abstract
Most deaths from cancer are explained by metastasis, and yet large-scale metastasis research has been impractical owing to the complexity of in vivo models. Here we introduce an in vivo barcoding strategy that is capable of determining the metastatic potential of human cancer cell lines in mouse xenografts at scale. We validated the robustness, scalability and reproducibility of the method and applied it to 500 cell lines1,2 spanning 21 types of solid tumour. We created a first-generation metastasis map (MetMap) that reveals organ-specific patterns of metastasis, enabling these patterns to be associated with clinical and genomic features. We demonstrate the utility of MetMap by investigating the molecular basis of breast cancers capable of metastasizing to the brain—a principal cause of death in patients with this type of cancer. Breast cancers capable of metastasizing to the brain showed evidence of altered lipid metabolism. Perturbation of lipid metabolism in these cells curbed brain metastasis development, suggesting a therapeutic strategy to combat the disease and demonstrating the utility of MetMap as a resource to support metastasis research..
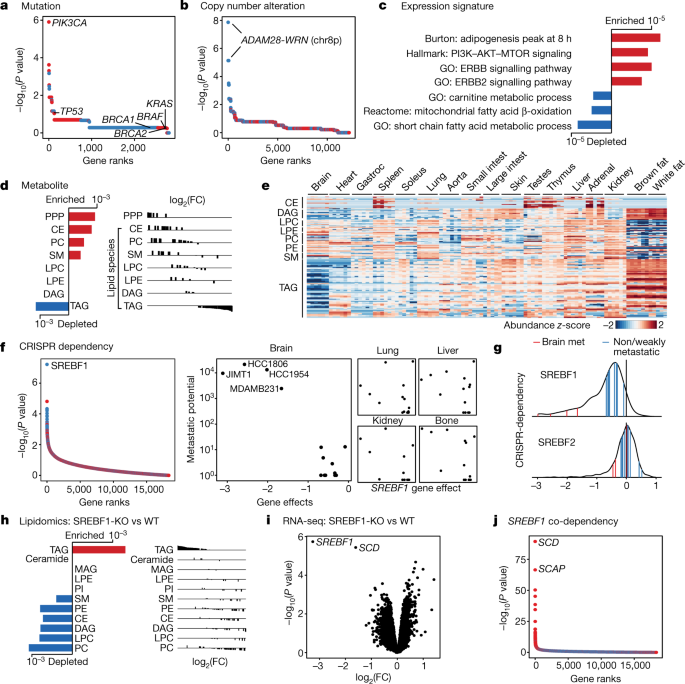
a, Somatic mutations that associate with brain metastatic potential in the basal-like breast cancer cohort. The top correlate, PIK3CA, reaches statistical significance (FDR = 0.0034, highlighted in bold). All PIK3CA mutations are activating. Positive correlations are in red, negative correlations are in blue. Selected known oncogenes or tumour suppressors in basal-like breast cancer are presented for comparison. b, Alterations in copy number that associate with brain metastatic potential. The top correlates cluster in chr 8p12–8p21.2 (FDR = 0.0017, highlighted in bold). c, Gene-expression signatures that associate with brain metastatic potential. Bars indicate P values. Expression signature scores were projected for each cell line with their in vitro RNA-seq data and used for regression analysis. GO (Gene Ontology), Hallmark, Reactome and Burton are gene sets in the MSigDB gene set enrichment analysis (GSEA) collection. d, Lipid-metabolite species that associate with brain metastatic potential. Bars indicate P values. Lipid metabolites measured by mass spectrometry were grouped by species, and enrichment analysis of the species was performed using GSEA. CE, cholesterol ester; PC, phosphatidylcholine; SM, sphingomyelin; LPC, lysophosphatidylcholine; LPE, lysophosphatidylethanolamine; DAG, diacylglycerol; PPP, pentose phosphate pathway metabolites. e, Heat map presenting distribution of lipid species measured by mass spectrometry from different mouse tissues. Gastroc, gastrocnemius. f, CRISPR gene dependencies that associate with brain metastatic potential. The top gene, SREBF1 (FDR = 0.001), is a selective dependency in highly brain metastatic lines. Positive correlations are in red, negative correlations are in blue. g, Distribution of SREBF1 (top) and SREBF2 (bottom) dependencies across 688 human cancer cell lines. The positions of highly brain metastatic (met) breast lines are highlighted in red, whereas weakly metastatic or non-brain metastatic breast lines are highlighted in blue. h, Consensus alterations in lipid species abundance upon SREBF1 knockout (KO) in JIMT1 and HCC1806, two brain metastatic cell lines. Bars indicate adjusted P values. Lipid metabolites measured by mass spectrometry were grouped by species, and enrichment analysis of the species was performed using GSEA. WT, wild type. i, Consensus gene-expression changes upon SREBF1 knockout in JIMT1, HCC1806, HCC1954 and MDAMB231, four brain metastatic cell lines. The two top genes are SREBF1 and SCD (FDR <0.05, highlighted in bold). j, Co-dependencies of SREBF1 across 688 human cancer cell lines in genome-wide CRISPR viability screen. The two top genes are SCD and SCAP (FDR < 1 × 10−60, highlighted in bold).
Given the observation that SREBF1 knockout resulted in a viability defect in vitro (Extended Data Fig. 10a), we compared the relative effect of knockout on metastasis to different organs, to determine whether the viability defect was preferentially observed in brain (Fig. 5d). Five weeks following intracardiac injection of SREBF1-knockout cells, we observed a marked defect in brain metastasis (196-fold reduction), compared with a modest defect in other organs (9–21 fold) (Fig. 5d). Histologic examination of brains from xenografted mice revealed large metastatic lesions in mice receiving wild-type cells, whereas those receiving SREBF1-knockout cells contained micrometastases (Extended Data Fig. 10b), suggesting that SREBF1 is not required for seeding the brain, but rather for proliferation in the brain microenvironment. Consistent with this hypothesis, injection of tumour cells into the carotid artery increased the probability of seeding the brain, but nevertheless a marked growth defect was still observed in SREBF1-knockout cells (Fig. 5e).
To determine the generality of the SREBF1 requirement for breast cancer growth in the brain, we knocked out SREBF1 in additional brain metastatic lines including HCC1954, MDAMB231 and HCC1806 using CRISPR–Cas9. As with JIMT1, a significant inhibition in brain metastatic growth was also observed in these lines, although the magnitude and duration of growth inhibition varied (Extended Data Fig. 10c, d). The least responsive cell line was HCC1806, in which SREBF1-knockout cells displayed a brain growth defect for the first week, but then assumed a growth trajectory that paralleled wild-type cells. This restoration of growth was not explained by reversion of the genome editing, as brain metastases at the end of the experiment showed evidence of editing at the SREBF1 locus and minimal SREBF1 protein expression (Extended Data Fig. 10e, f). Instead, we found that the SREBF1-independent growth was associated with upregulation of the fatty acid transporter CD36 and the fatty acid-binding protein FABP6 (Extended Data Fig. 10g). Of note, culture of HCC1806 in mouse brain-slice-conditioned medium similarly resulted in upregulation of SCD and CD36 expression (Extended Data Fig. 10h, i). JIMT1 cells did not upregulate CD36 or FABP6 expression following SREBF1 knockout (Extended Data Fig. 10g), perhaps explaining their inability to survive in the brain. Together, these results further demonstrate the relationship between lipid metabolism and brain metastasis, as cells under the selective pressure of SREBF1 loss must acquire lipids by other means to survive in the brain microenvironment.
Discussion
This work describes MetMap as an approach for large-scale in vivo characterization of human cancer cell lines. The MetMap resource (available at https://pubs.broadinstitute.org/metmap) currently includes metastasis profiles of 500 cell lines spanning 21 tumour types, providing a large repertoire of models for exploration of metastasis mechanisms. A limitation of the use of human cell lines for such experiments is that they require the use of immunodeficient mice. The extent to which the immune system has a role in mediating patterns of metastasis remains to be determined37.
We followed up only a small proportion of the MetMap findings—specifically, breast cancer metastasis to brain. Multiple lines of experimental and clinical evidence pointed to a role of lipid metabolism in governing the ability of cells to survive in the brain microenvironment. The importance of lipid metabolism in cancer has been highlighted by a number of studies, but its role in brain metastasis has, to our knowledge, not been fully appreciated38,39,40,41. The possibility that interfering with lipid or cholesterol metabolism might abrogate metastatic growth in the brain is particularly intriguing. More generally, this work illustrates the complex interplay between cancer cell growth and the tissue microenvironment.
2023
https://www.nature.com/articles/s41467-023-44206-x
Pathway centric analysis for single-cell RNA-seq and spatial transcriptomics data with GSDensity
Nature Communications volume 14, Article number: 8416 (2023)GSDensity can identify spatially relevant pathways in mouse brains and
human tumors including those following high-order organizational
patterns in the ST data. Particularly, we create a pan-cancer ST map
revealing spatially relevant and recurrently active pathways across six
different tumor types.
The proliferative ability of tumor cells could be regulated through their interactions with the TIME27,28. We then compared these actively dividing cells with other tumor cells from the angle of cell-cell interaction between tumor and TIME. We annotated the normal cells in the TNBC-1 dataset into two groups, fibroblasts, and immune cells (Supplementary Fig. 6b, c) and inferred the ligand-receptor interactions29 between immune and tumor cells and between tumor and tumor cells. We displayed all the ligand receptor-pairs in Supplementary Fig. 7a and found that the dividing cells showed a distinct profile of the GAS6-TYRO3 axis. All the other ligand-receptor pairs showed differential enrichments in either immune-tumor interaction or tumor-tumor interaction, while GAS6-TYRO3 was the only pair that showed differential enrichments in both groups. We then found that both the tumor cells and the immune cells could express the ligand, GAS6, while only the dividing tumor cells displayed high expression of the receptor, TYRO3 (Fig. 3h), which indicated the specific activation of the TYRO3 downstream signaling in those cells. For confirmation, we also fetched actively dividing tumor cells from another two TNBC datasets25, TNBC-2 and TNBC-5, and these cells also consistently showed high relevance to glycolysis, mTORC1 signaling, and mitotic spindle (Supplementary Fig. 6d–k, p-value < 2.2e−16 for all groups, Chi-squared test). The high expression of TYRO3 in actively dividing cells was also observed in the TNBC-5, confirming the previous finding (p-value = 3.18e−8, Wilcoxon test, Supplementary Fig. 6l–m). We then investigated this TYRO3 expression pattern in another published cohort with 8 TNBC patient samples30. TYRO3 were lowly detected in 7 of the samples (detected in 1–8% of tumor cells). In the only sample (GSM4909284_TN-MH0114-T2) with relative high expression of TYRO3 (detected in 24% of tumor cells), the actively dividing cells showed higher expression of TYRO3 than other tumor cells (p-value = 0.039, Wilcoxon test, Supplementary Fig. 6n). These results indicated that the overall expression level of TYRO3 in breast cancer cells is highly patient specific, while the high-TYRO3 expressing samples always had TYRO3 preferably express in a small group of actively dividing cells. The GAS6-TYRO3 axis has been associated with tumor cell proliferation, malignancy, and anti-PD1/PD-L1 resistance in previous studies31,32,33,34,35. Thus, through the integration of data and prior knowledge using GSDensity, we postulated a potential role TYRO3 in TNBC proliferation using only a few TNBC samples with very sparse single-cell gene expression profiles and generated a testable hypothesis for further studies.
..
We applied GSDensity to a ST mouse forebrain dataset generated by the 10X Visium technology. We first clustered the data spots based on the transcriptome (Fig. 5a) and observed that all the clusters were also spatially segregated on the spatial map (Fig. 5b). Thus, the pathways with cluster-wise specificity would naturally display spatial relevance in this data. However, it is unclear whether there are high order organization of pathway activities across multiple clusters, which would be undetectable in cluster-centric analysis. To address this question, we first identified 727 GO biological process terms with coordination in the dataset using GSDensity. For each term, we calculated its spatial relevance and specificity for each cluster. The spatial relevance is quantified by KL-divergence between the pathway weighted kernel density estimation (KDE) and the equally weighted KDE (Methods). The specificity of a pathway for a cluster is quantified by a specificity score based on Jensen-Shannon divergence, with larger values being more specific. We then plotted the 727 GO terms with their spatial relevance and maximum cluster-wise specificity (Fig. 5c). As expected, the spatial relevance showed largely positive correlation with cluster-wise specificity. Among the GO terms with high cluster-wise specificity (Fig. 5c, red) are dopamine receptor signaling for Cluster 1, amyloid beta formation for Cluster 5, ARP2/3 complex mediated actin nucleation for Cluster 8/11, and oligodendrocyte development for Cluster 2 (Fig. 5d–g). Interestingly, we also observed some GO terms with high spatial relevance and low cluster-wise specificity (Fig. 5c, blue). The cells highly relevant to these terms consisted of data spots from multiple clusters with higher-order spatial organization (Fig. 5h–k). For example, positive regulation of cellular response to insulin stimulus appeared highly active in the spots close to the caudal side (Fig. 5i), while fatty acid oxidation to the ventral side (Fig. 5j). It has been known that insulin receptors are expressed in hypothalamus and hippocampus43 which are both located close to the caudal side of this anterior section. Although GSDensity was designed to perform cluster-independent data analysis, we demonstrated that the pathway activity calculation by GSDensity can be easily integrated with cell information, such as cluster partition or spatial coordinates, when available.
..
Like the scenario of the mouse brain data, some pathways were both highly spatially relevant and highly cell-type specific, for example, protein localization to synapse was highly specific to inhibitory neurons and sensory perception of smell was highly specific to excitatory neurons, both of which occupied localizations with spatial relevance on the map (Supplementary Fig. 10c, d).
..
Inga kommentarer:
Skicka en kommentar